How to Debug Burp Suite Extensions with IntelliJ
This article guides you through configuring IntelliJ to start a debugging session with Burp Suite seamlessly at the click of a button. Streamline your workflow and enhance your ability to test Burp Suite extensions faster and more efficiently.
Burp Suite extension development is a rewarding challenge, but it can be time-consuming without the right tools. It requires a fair amount of experience with Java, it’s difficult to write tests without having to mock all Montoya objects, and debugging the code while running Burp Suite can be tedious. After this how-to, you’ll have one less thing to think about.
Requirements
The following are the requirements for developing and debugging Burp Suite extensions with Intellij. While familiarity with either the Montoya Api or Wiener Api is recommended, it’s not required for this how-to.
- IntelliJ
- Java 21 and lower
- Burp Suite Community/Professional (ScanChecks are not allowed within Community Edition)
- A Burp Suite extensions project written in Java; it does not matter if Montoya Api or Wiener Api are used.
For this how-to, I’ll be using my personal Burp Extension Boiler Plate project which was created to help testers start writing extensions without requiring all the setup.
1. Setting Up Your Project in IntelliJ
- Make sure you have the project on the machine. If you’re following the how-to go ahead and
git cloneor download the repo from GitHub. - Open IntelliJ.
- Open a new or existing project depending on your situation.
- Allow IntelliJ to process the project as either gradle or maven
2. Building the Jar File for an Extension
Both Maven and Gradle are used when writing Java to help manage project dependencies and automate the build process. For more information: Difference between Gradle and Maven
Maven
Since IntelliJ was told that the project was Maven, it should be fairly simple.
- Navigate to the
POM.xmlfile. Right-click -> Maven -> download sourcesThis will download the required dependencies to build the project.- Open the Maven lifecycle window in IntelliJ.
- Double-click
packageto build the jar which can be found intarget/boilerplate-1.0.0.jar. The target directory is created during the building process.
Gradle
To build the jar using Gradle, follow these steps:
- Navigate to the
build.gradlefile. - Open the Gradle tool window in IntelliJ.
- Ensure that all dependencies are downloaded by refreshing the Gradle project.
- In the Gradle tool window, navigate to
Tasks>build. - Double-click on
buildto execute the build task. This will compile the project and create the jar file. - The jar file can be found in
build/libs/boilerplate-1.0.0.jar. Thebuilddirectory is created during the building process.
3. Configuring the JDWP Debugging Agent
We’ll be using Java JDWP for remote debugging. For some background, a Java Debug Wire Protocol (JDWP) agent allows remote debugging of Java applications by providing the agent’s profile to Java when executing a jar.
Debug Agent Configuration:
1
-agentlib:jdwp=transport=dt_socket,server=y,suspend=n,address=*:5005
| Configuration | Description |
|---|---|
transport=dt_socket | Use socket transport for communication. |
server=y | Enable the JVM to listen for a debugger. |
suspend=n | Don’t suspend the JVM; continue running. |
address=*:5005 | Listen on port 5005 for debugger connections. |
4. Setting Up IntelliJ to Debug Burp Suite
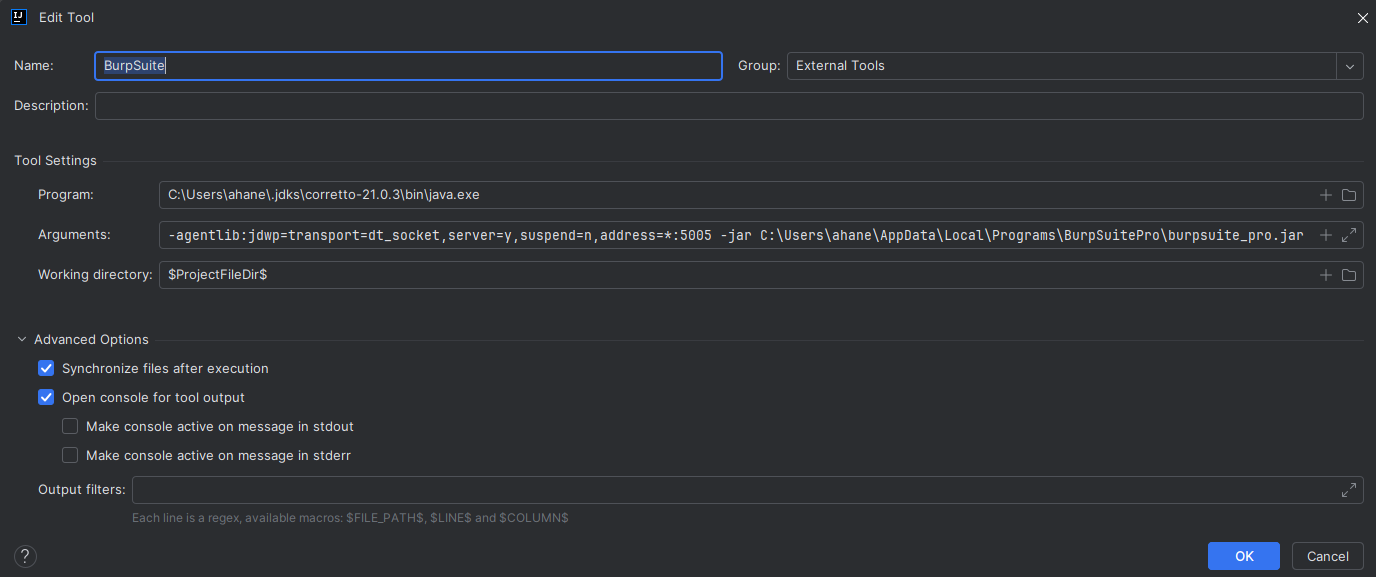
We’ll be using IntelliJ’s ability to execute other tools. To do this:
- Click on
File -> Settings -> Tools -> External Tools - Add a tool with the
+button - I’ve named my tool “BurpSuite”
- Fill out the following
Programs: this will be the path to your Java executable, i.e. java.exeArguments: this will be the JDWP agent from the previous section prepended with the full path to your Burp Suite Java executable. (burpsuite.jar)
- Make sure the
Open console for tool outputcheckbox is checked. - Click “Ok”
Windows users will find their Burp install here most likely.
5. Run the Burp Suite External Tool
To run external tools use the Tools menu item in the top left.
- Run the tool
Tools -> External Tools -> BurpSuite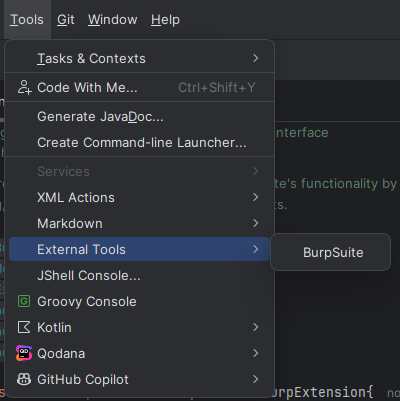
- Attach the debugger within the terminal that pops up. (Hint: it’s a button)

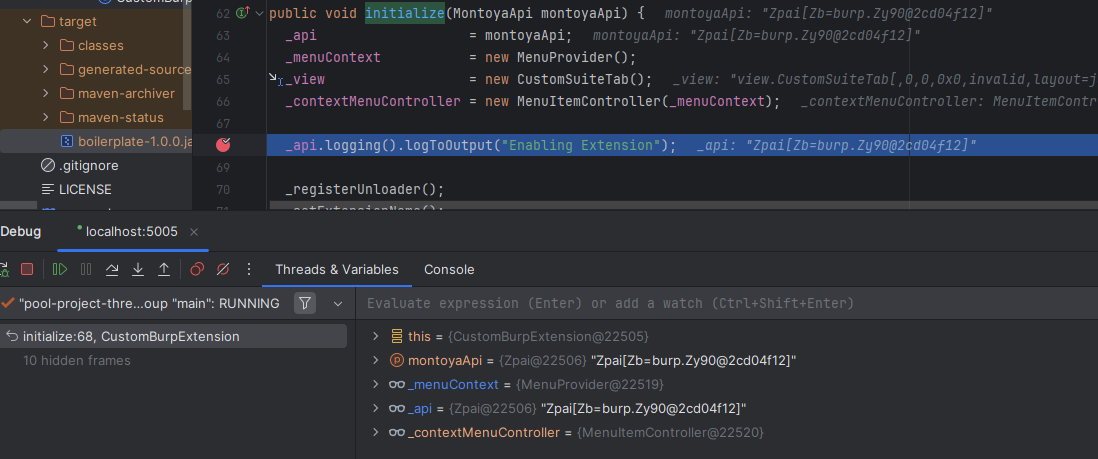
- Confirm the debugger is attached by looking in the debug windows

6. Actually debugging
Add a breakpoint to something that will execute. I chose to add a breakpoint to the
initialize(MontoyaApi)function since that’s the first thing that is called by Burp Suite.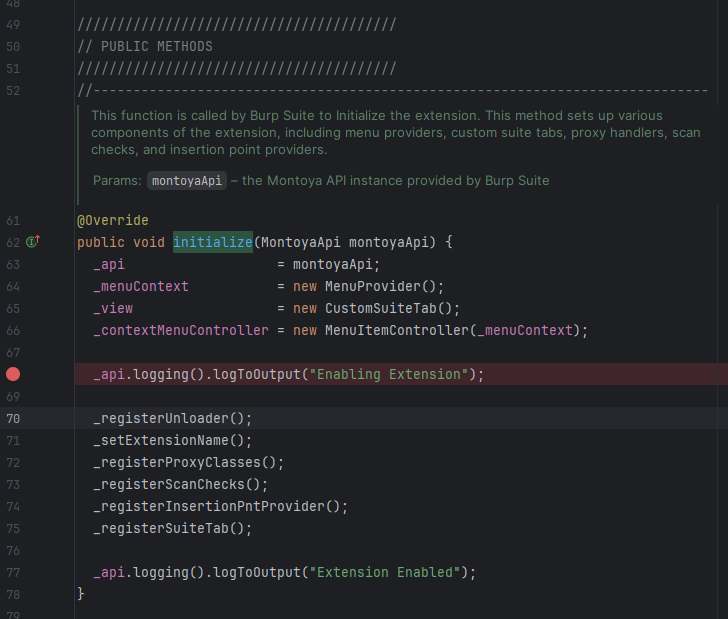
7. Adding More Convenience
While this configuration is not required, it turns a 4-click action into a 2-3-click action depending on when you last ran the debugger.
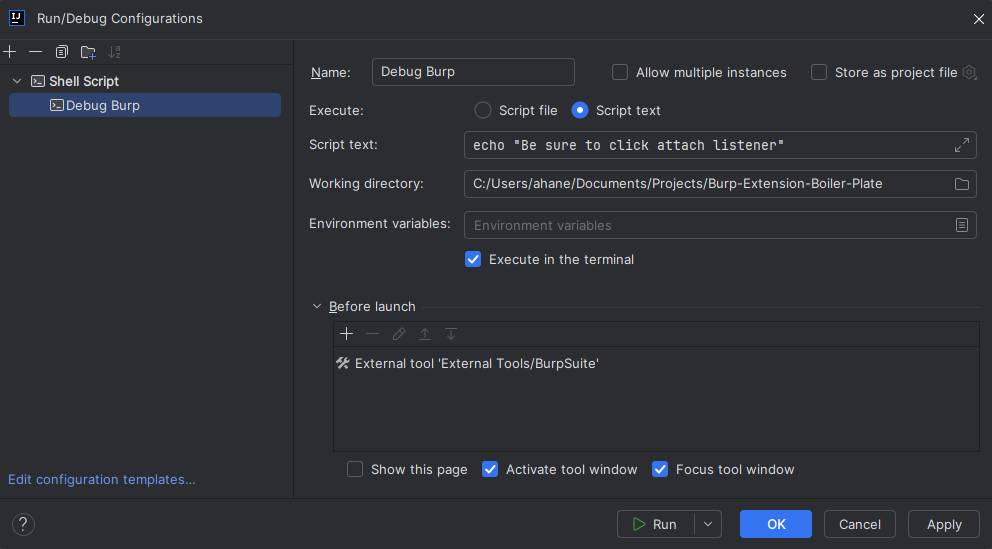
- Create a Debugging Configuration:
Run -> Edit Configurations.... - Add a new configuration with the
+button. The configuration does not matter, we just need a quicker way (less clicks) to run the tool and IntelliJ does not directly provide one to which we can attach a listener. - I chose “Shell Script” and added:
1
  echo "Be sure to click attach the listener
(the actual config/script does not matter, make it do nothing if you want)
- Add a
Before Launchaction with the+button and addExternal Tools/Burpsuite. - Ensure the
Activate tool windowandFocus tool Windowboxes are checked.
Tips & Tricks
You can quickly disable and re-enable any extension with
Ctrl + Left Mouse Clickon the extension checkbox.
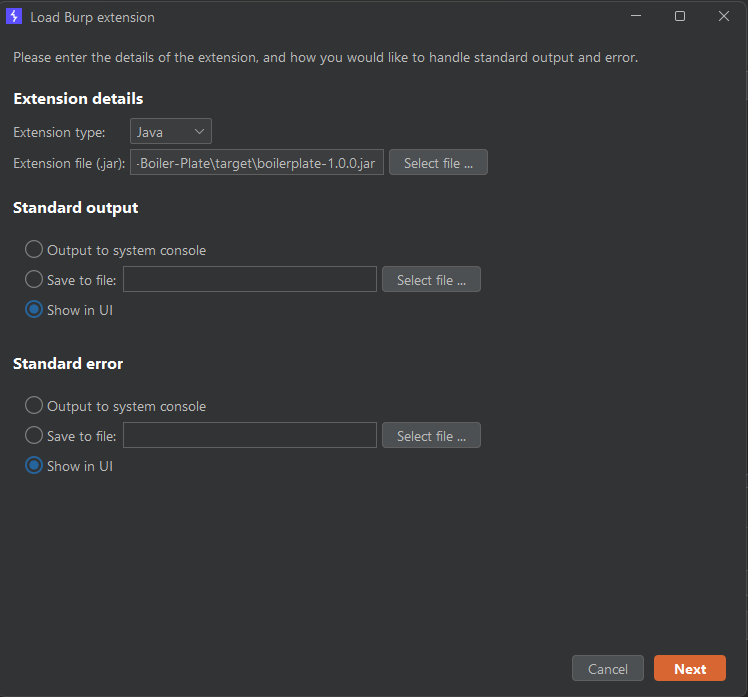
To test any new code changes, you’ll have to rebuild the jar and reinstall/re-enable the jar within the Burp Suite instance currently being debugged.
If you have multiple Burp Suite instances open, only the Burp Suite opened using the debugging profile will have debugging enabled.
Troubleshooting
Debugger Fails to Attach: Ensure that port 5005 is not blocked or already in use by another process. You can use netstat or similar tools to check port availability.
JDWP Agent Errors: Double-check the debugging agent configuration string to ensure there are no typos. Ensure that the Java version matches your Burp Suite requirements.
Jar File Not Found: Ensure you’ve built the jar file correctly and that the file path is accurate. Refresh Maven/Gradle dependencies if needed.
Conclusion
Debugging Burp Suite extensions with IntelliJ doesn’t have to be difficult. By following this guide, you’ve streamlined your workflow and gained the tools to test your extensions efficiently. Whether you’re a seasoned developer or new to extension development, these steps should help you work smarter, not harder. If you have questions or feedback, feel free to reach out or explore the Burp Extension Boiler Plate project for more resources.

